VisionGauge® OnLine version 17.09, dated June 23, 2024, is available for download.
In addition to 64-bit support to grant greater access to RAM and general speed improvements, the following new features and enhancements have been added over the past several versions:
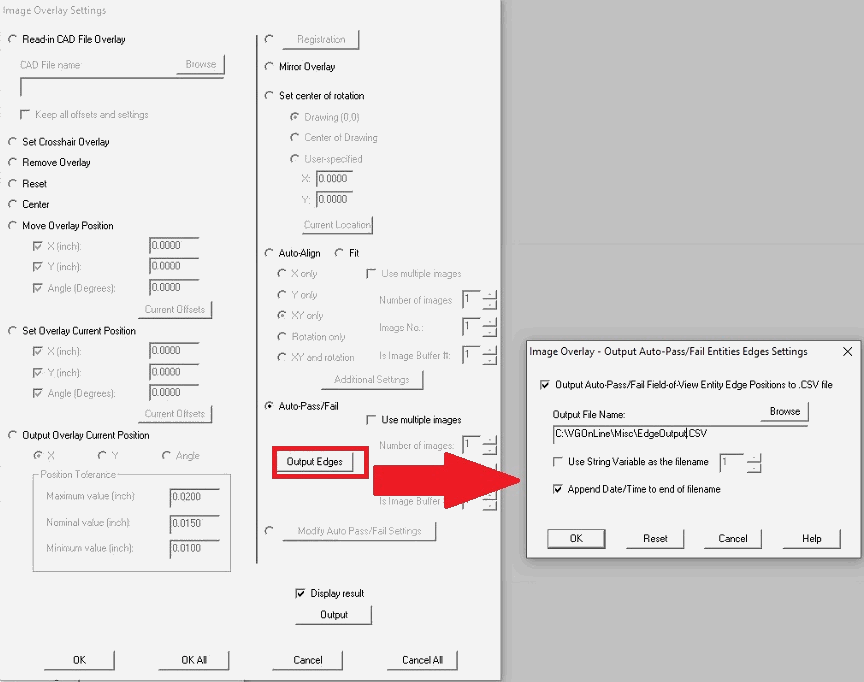
We’ve enhanced our groundbreaking and patented CAD Auto-Align™ CAD Auto-Pass/Fail™ tools to continue making them even more widely applicable, robust, and accurate. And recently we carried out a number of enhancements geared towards supporting very large CAD files. The resulting accelerations, optimizations, and enhancements yield a tremendous speedup (typically: by a factor of 40 or higher) that will be useful in a very wide range of applications.
We’ve carried out a number of enhancements to our iterative 6-point nest part reorientation tool that have increased its applicability and improved its performance, and we’ve also carried out extensive systematic testing to document how our innovative algorithm correctly “re-orients” the part, corrects for fixturing variation, and produces accurate results.
An update changes the behaviour of the Settings Toolbox when attempting to change buttons that load magnifications on multimag systems. Now if the system is already at a magnification and a button is selected that would load the same magnification, the system will not change the multimag position. All other parameters saved in that Settings Toolbox button will still change, though (e.g. illumination, camera format files, units, etc.).
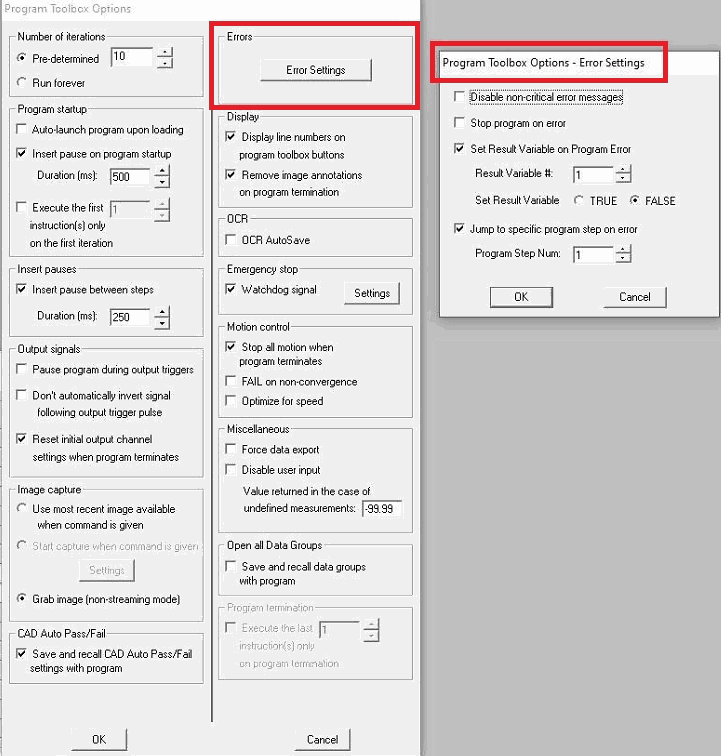
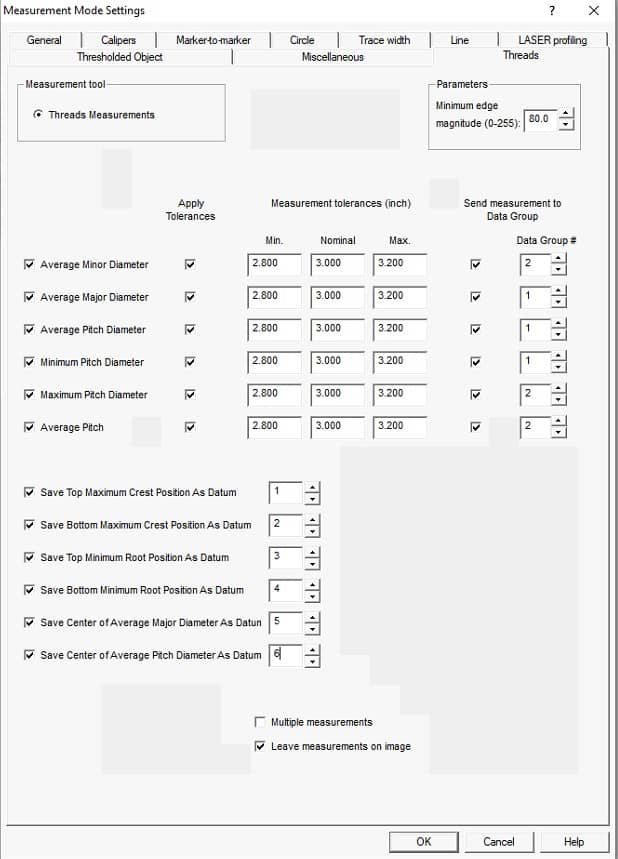
A new test has been added to the “Data Groups and Statistics” step of the Program Toolbox to test the range of the last two additions to a Data Group.
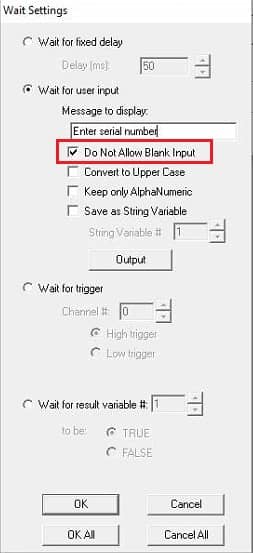
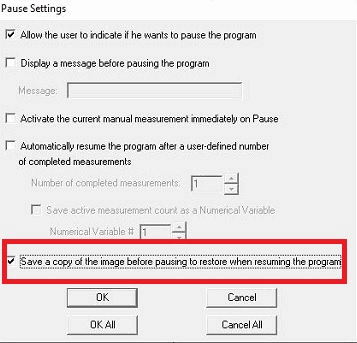
A new option has been added to the Program Toolbox’s “Wait” menu for Operator Input that requires the operator to manually choose a Pass or Fail value. This can be useful if a previous operation requires an operator decision.
We have added a new “Units” step in the Program Toolbox to allow changing the current set units during the course of a running program.
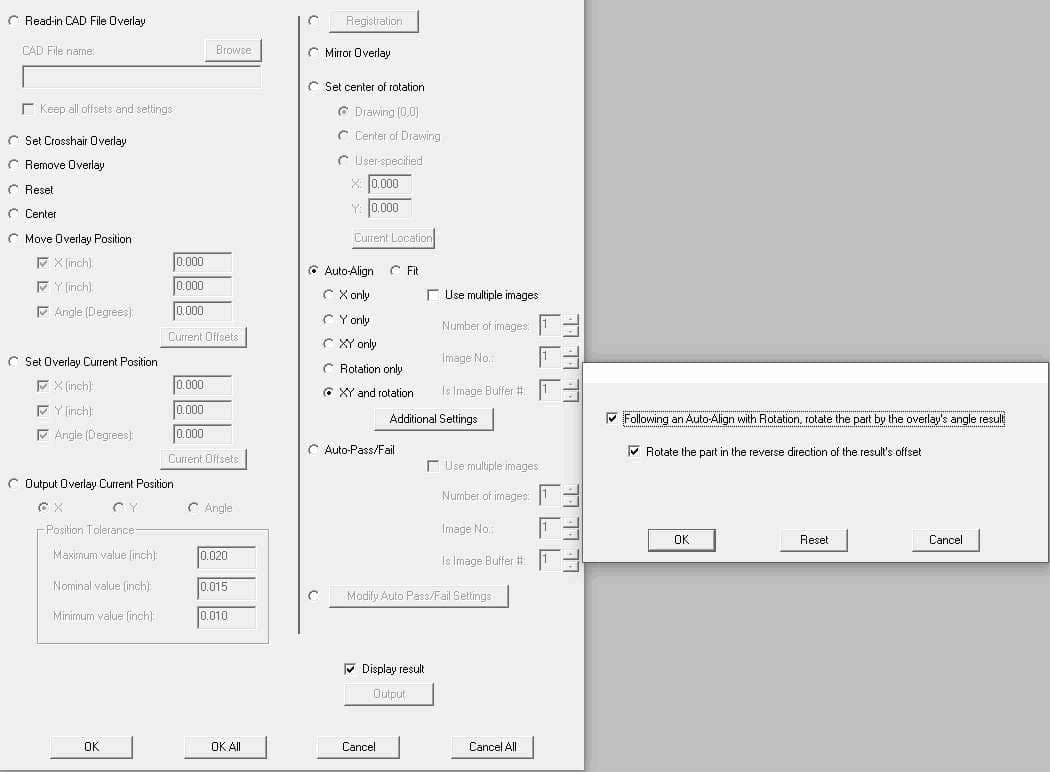
We have added the ability to set Auto-Align Settings in Program Toolbox “Image Overlay” steps.
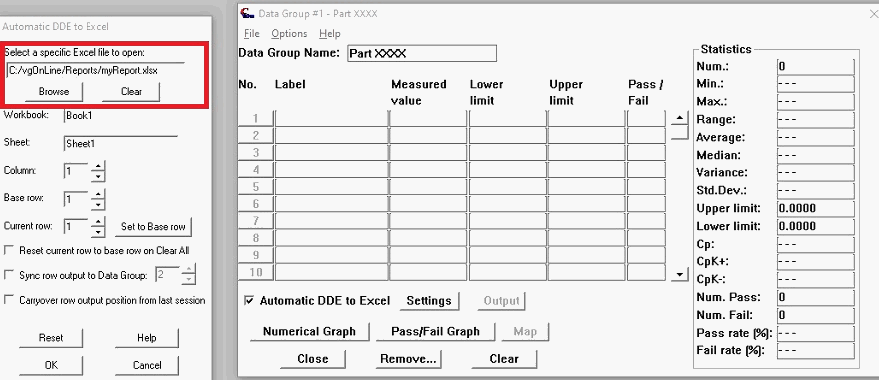
A recent update modifies the actions the user can take in the Data Group’s Pass/Fail map. When single clicking on a Pass or Fail region in the map, if the Data Group is collecting images, the image from that location will be displayed. Previously single-clicking on that region would move the stage to that location with live video activated: This stage movement action has now been set when double-clicking on the region.
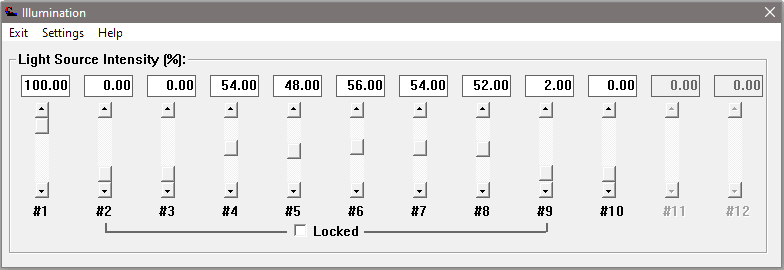
We have updated support for Computer Controlled Illumination devices to allow multiple mixed devices to function on the same system and to support new multi analog output channels on a single device.
This update adds a new option when outputting data from VisionGauge® OnLine to Excel via DDE. Previously all transfers to Excel were asynchronous which could have the chance to overload Excel with commands on slower systems or if Excel had additional tasks to respond to in the background. In that scenario, Excel may have disconnected from VisionGauge® OnLine and reset the transfer parameters. This new update adds an option to use synchronous data transfer to Excel, which forces Excel to acknowledge each transfer and respond. Synchronous transfer may be slightly slower and VisionGauge® OnLine may pause while waiting for a response from Excel, but there is no data loss or resetting of parameters. This data transfer option may be found in the “Customize – Data Transfer – Excel” menu.
Writing data to files during a shutdown procedure has been improved for various files types. which could prevent lost settings when shutting down under certain circumstances.
We have added a timeout parameter for single image capture operations that could be used when slower framerates are being applied.
Added the ability to allow operator access to the Measurement Toolbox “Open” menu in the Security Manager when password protection is enabled
A software instability has been fixed when reading some .dxf files with Polylines or LWPolylines with certain data.
A timeout issue with the hardware security key has been resolved that could prompt “dongle” errors during use of the software then force the software to shutdown.