VisionGauge® OnLine version 15.62, dated February 7th, 2023, is available for download.
The following new features and enhancements have been added over the past several versions:
Overlay Toolbox Pinned buttons
The Overlay Toolbox has been enhanced to allow ‘pinned buttons’ at the top of the list. These pinned buttons will not be cycled down the list of quick recall overlay buttons when reading in a new overlay, and the information loaded into them will persist session after session. These buttons are outlined at the top of the Overlay Toolbox. New overlays loaded through typical actions (Program Toolbox steps, barcode scanning, Overlay Toolbox “Browse” button, etc.) will be loaded into the non-pinned section as usual after these pinned buttons.
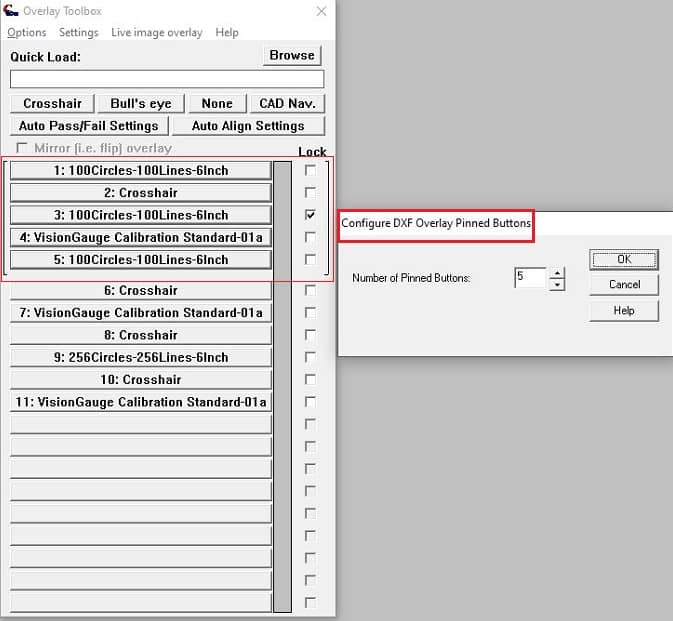
A new item in the Overlay Toolbox “Options” menu allows users to configure how many buttons are currently pinned. It is possible to pin the full toolbox set (currently updated to 40 buttons).
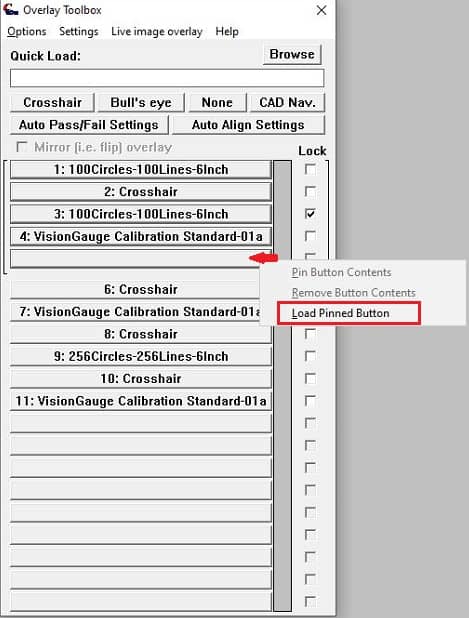
Loading a pinned button is possible by two methods:
You may right-click on the pinned button you want to load and select the “Load Pinned Button” menu option. You can then browse to a file to load as usual.
You may-right-click on an already loaded Overlay Toolbox button and select “Pin Button Contents”, then select to which pinned button number you want to copy this overlay.
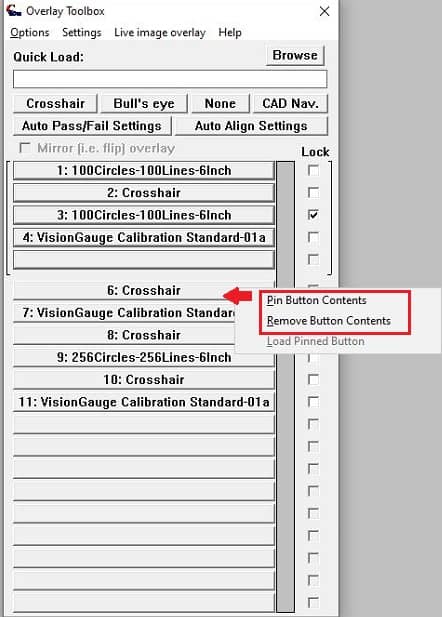
It is now also possible to remove the contents of an Overlay Toolbox button by right-clicking the button and selecting “Remove button contents”.
These new options are capable of password protection through the Security Manager. We have also added options in the Operator Mode to disable/enable access to these options.
Also, a new “Options” menu item in the Overlay Toolbox allows the user to specify “40 buttons”. When this option is selected, two tabs will appear at the bottom of the Overlay Toolbox. The left tab will display Buttons 1-20 and the right tab will display Buttons 21-40.
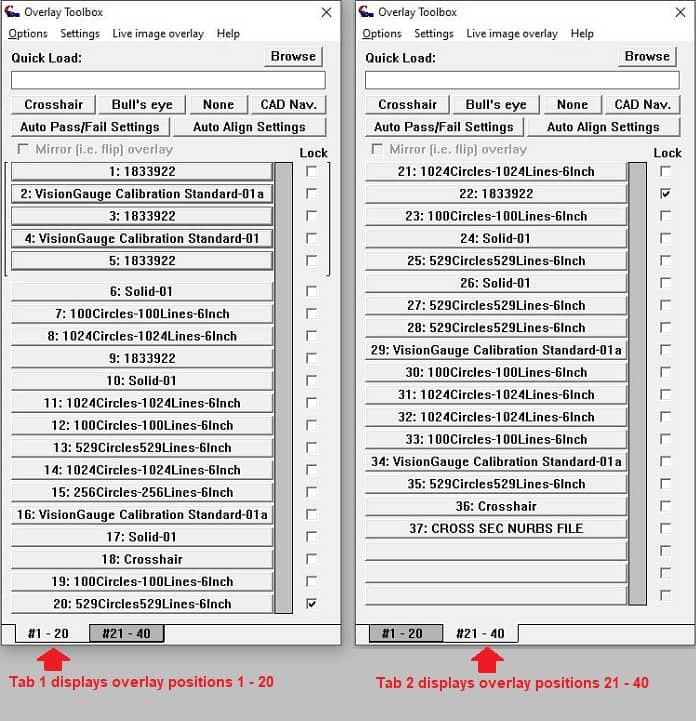
The last open tab will carryover between sessions of the software. Also the current number of pinned buttons will be taken into consideration across both tabs, allowing for a total of 40 pinned buttons, if required.
Note, loading a new overlay with the Browse option, by the Quick Load, or through the Program Toolbox will add the overlay to the first ‘unpinned’ button, as usual. If the first unpinned button is located on the non-active tab, the tabs will automatically change to display the last opened overlay.
Auto-Pass/Fail Entities Cross Section Analysis/Report
This update adds support for an Analysis and Report mode for Auto-Pass/Fail Entities. This feature works for entities setup either manually or automatically read in from a nominal/minimum/maximum set of DXF files.
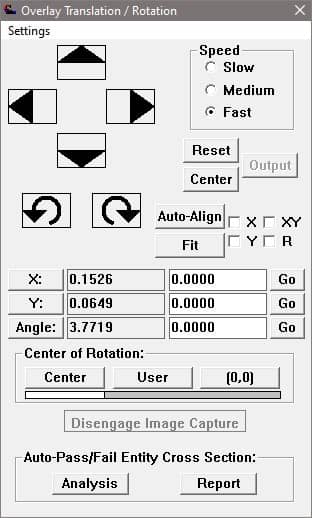
These Auto-Pass/Fail Entity Cross Section Analysis and Report modes are accessible through the Overlay Translation/Rotation dialog when live video is activated with an overlay configured with Auto-Pass/Fail Entities.
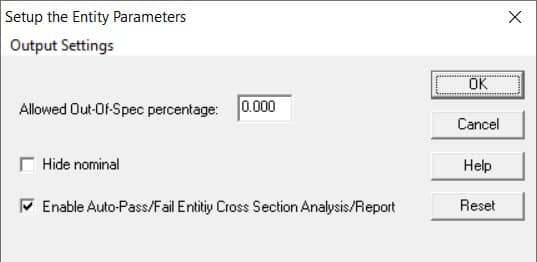
Users may disable/enable access to the Analysis and Report options in “Overlay Toolbox – Auto-Pass/Fail Settings – Entities” section. The option is immediately accessible when loading the Entities settings for a file setup by reading in .dxf files with the minimum and maximum tolerances in addition to the nominal .dxf file. If Auto Pass/Fail Entities have been manually setup on a .dxf file, the option to access these Analysis/Report settings is available in the Entities General Settings menu.
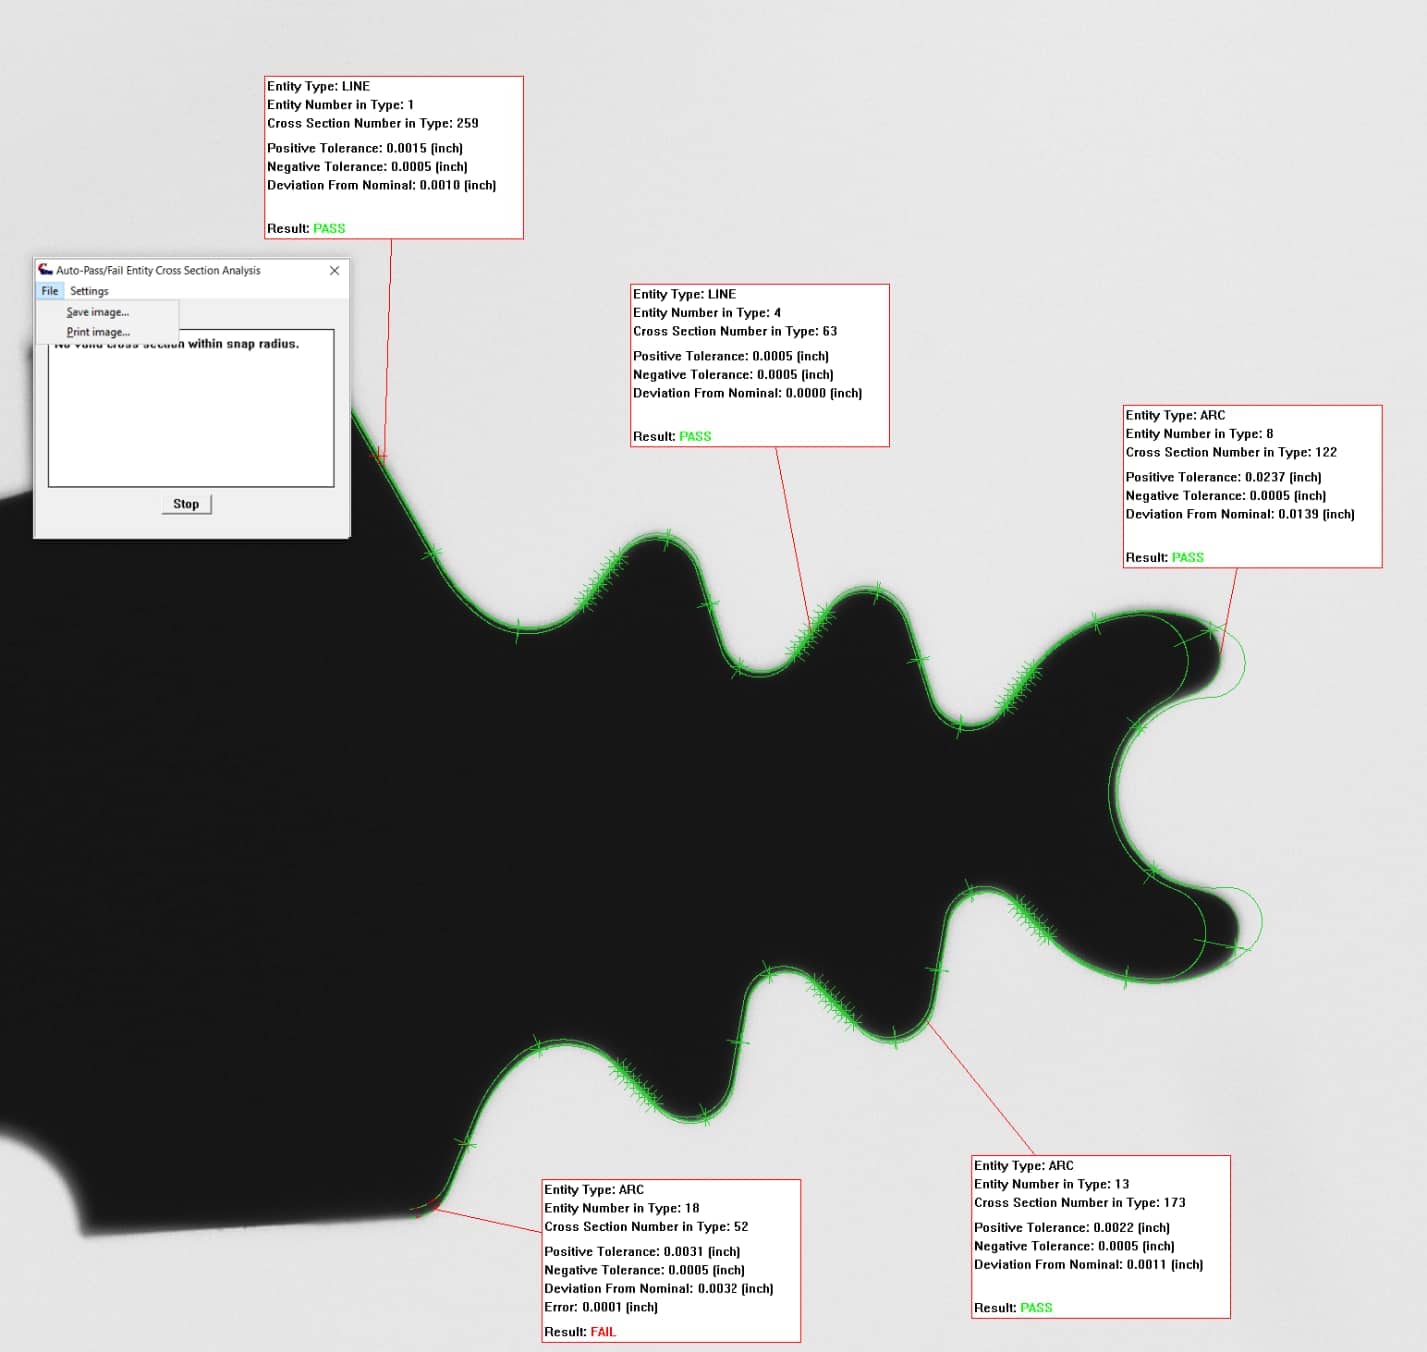
The Analysis mode allows user to inspect and annotate the cross sections along each Entity found in the current field-of-view. A ‘control’ window displays the results of each cross section the mouse cursor is currently highlighting. The mouse cursor will snap to the closest cross section nominal position within a ‘snap radius’ and will also draw a cursor over the edge point located for that cross section, if one was found. Information displayed about each point includes the Pass/Fail result, tolerance information, deviation from nominal, and error from being in tolerance if the result if a Fail.
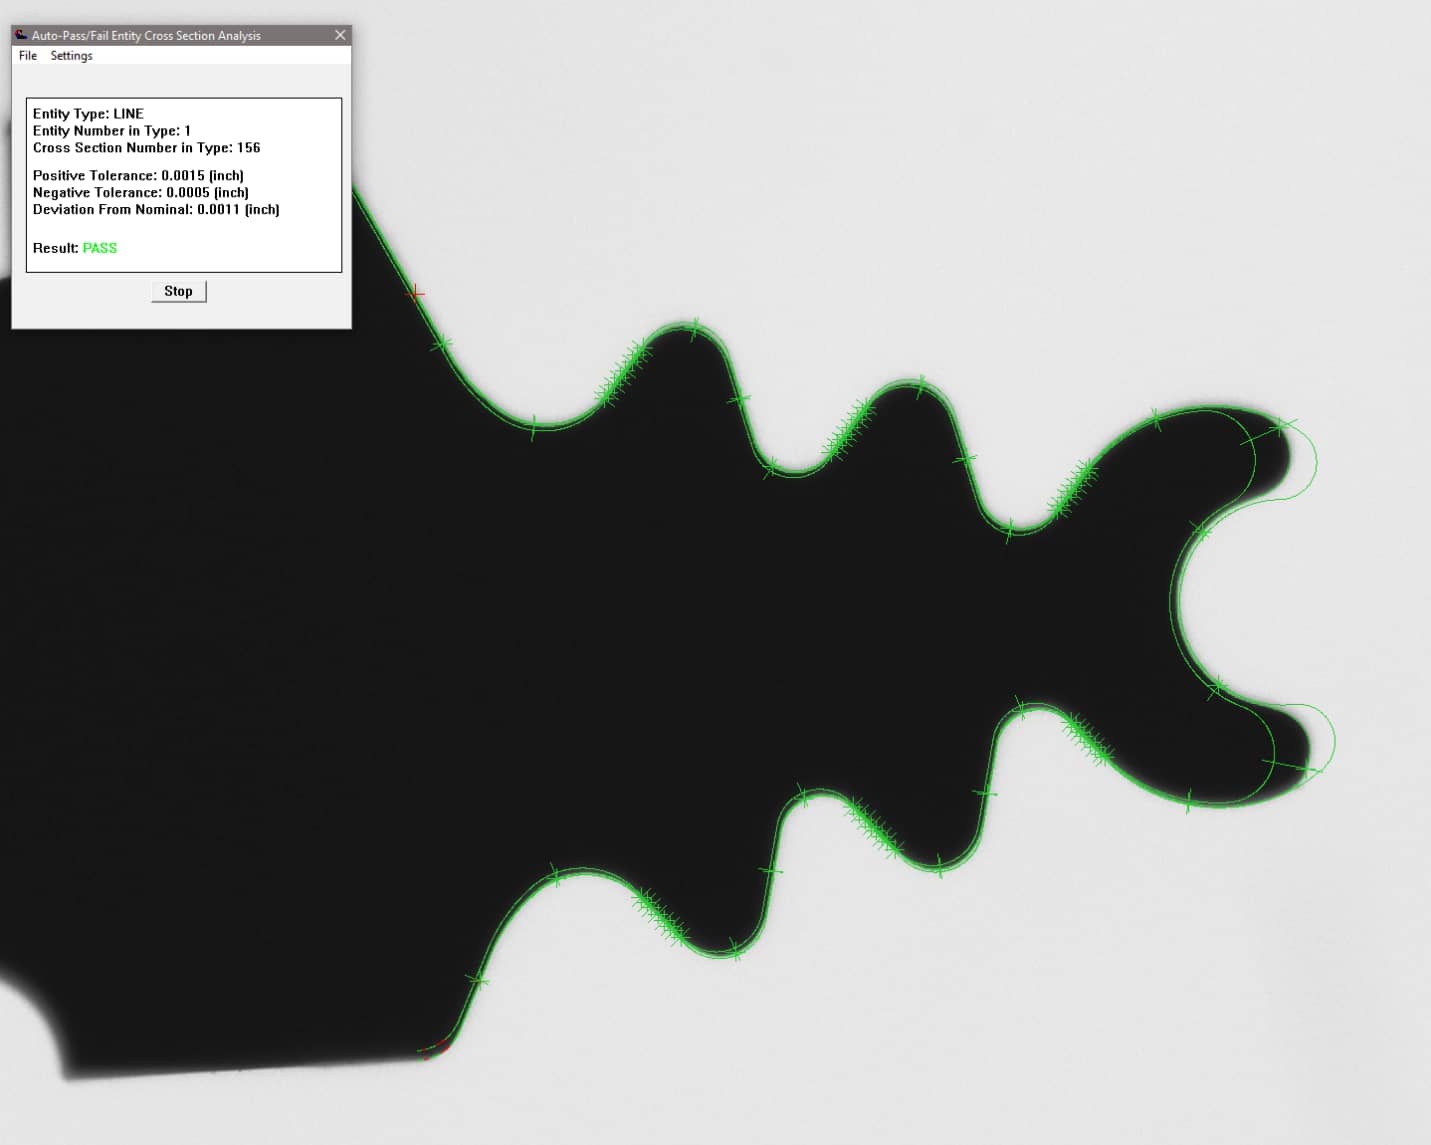
By left-clicking the mouse on the image when a cross section is highlighted, the user will enter an annotation mode where a location can be set for an information box displaying the data for that particular cross section.
The snap radius of the mouse cursor can be adjusted in the Settings menu for this tool. Users may also choose if they want to snap only to Failed result points and configure the data displayed in the annotation box on the image.
When the current “Analysis” has been completed, the user can opt to Save or Print the image by using the “File” menu options.
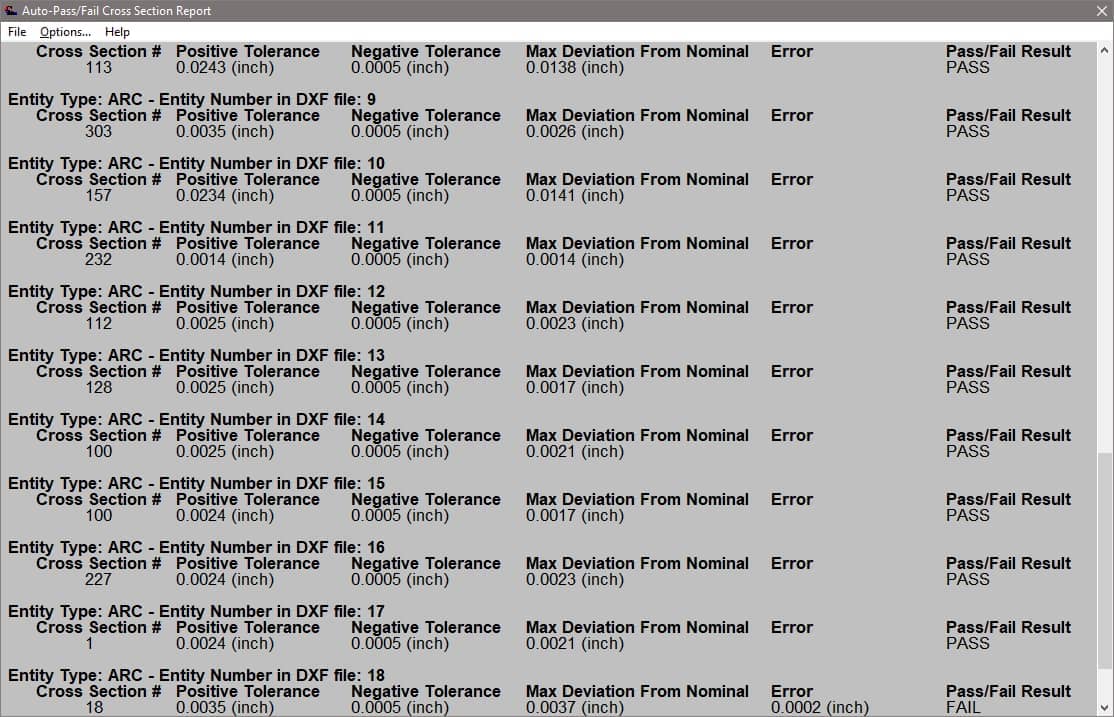
The Report mode displays all cross sections for Auto-Pass/Fail Entities found in the field-of-view in a scrollable report. Hovering over a cross section in the report will display the edge point found, or the nominal point of the cross section if an edge was not found, on the image. An option to display the cross section in a magnified box is enabled by default. The magnification level is controlled by the same settings that control the main window’s “Magnify” operation in the “Settings – General Preferences” menu.
Various data filters in the Report’s “Options” menu allow the user to choose which data is displayed in the report, including options to display all Pass/Fail results, only Pass results, or only Fail results.
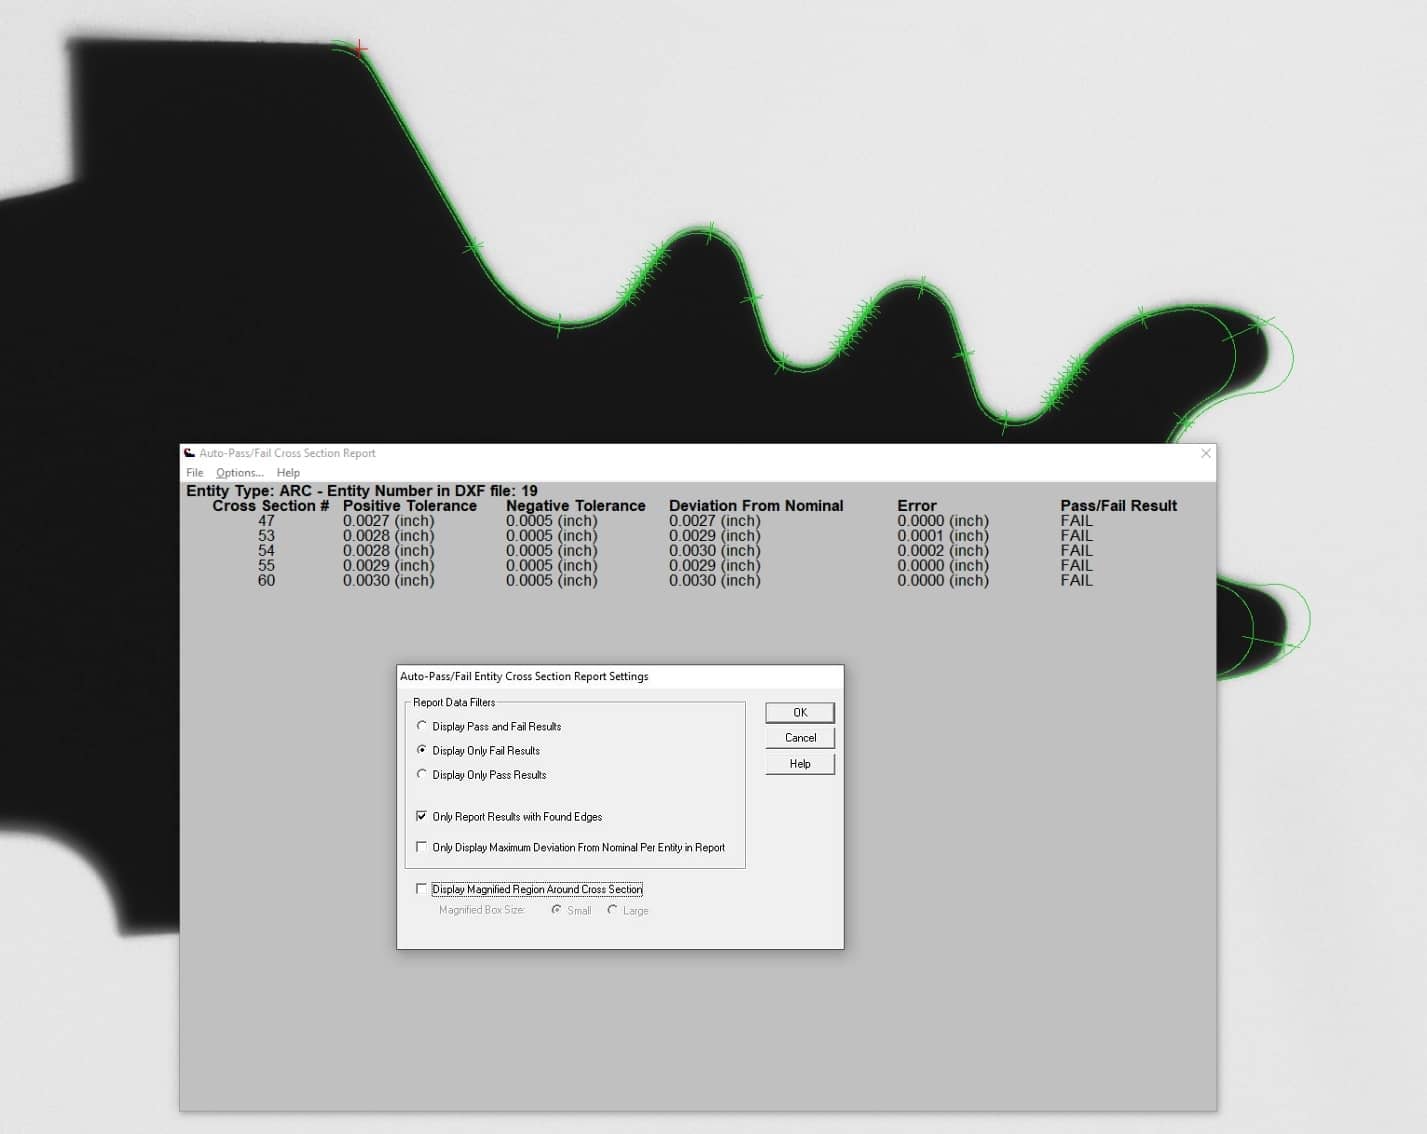
Another data filter provides the option to “only display maximum deviation from nominal per entity in the report”.
The report menu also allows writing the edge points found for all cross sections displayed in the current report as either a .CSV file or a .DXF file (with POINT entities).
Auto-Pass/Fail Across Multiple FOV’s in Automated Programs
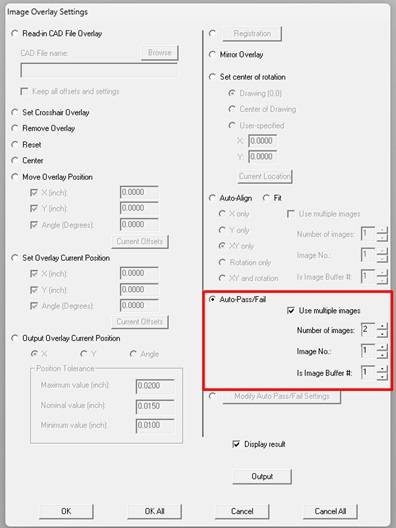
We’ve added support for CAD Auto-Pass/Fail across multiple field-of-view in the Program Toolbox – Image Overlay settings. This feature can now use the multiple image buffers that were previously setup to run these multi-FOV operations and obtain Pass/Fail value across the different FOV’s.
Read more about our enhanced CAD Auto-Align™ beyond the field-of-view.
Auto Pass/Fail Entities – Output Settings
The Auto Pass/Fail Entities feature to Output Settings (Outputting Edge Points) to file has been enhanced with additional columns of data for each edge point.
This report now includes all of the following information:
Nominal X & Y coordinate
Negative direction tolerance band X & Y coordinate
Positive direction tolerance band X & Y coordinate
Edge X & Y coordinate
Deviation from nominal
Pass/Fail
VisionGauge®’s new “CAD Fitting™” tool
The new CAD Auto-Align™ feature “CAD Fitting™” has been added to the Overlay Translation/Rotation window for manual operation and the Program Toolbox – Image Overlay step for automated programs. This alternate mode of the CAD Auto-Align tool can help obtain Pass results in trickier conditions. Learn more about the CAD Fitting™ tool.
CAD Auto-Align™ beyond the field-of-view and depth-of-field
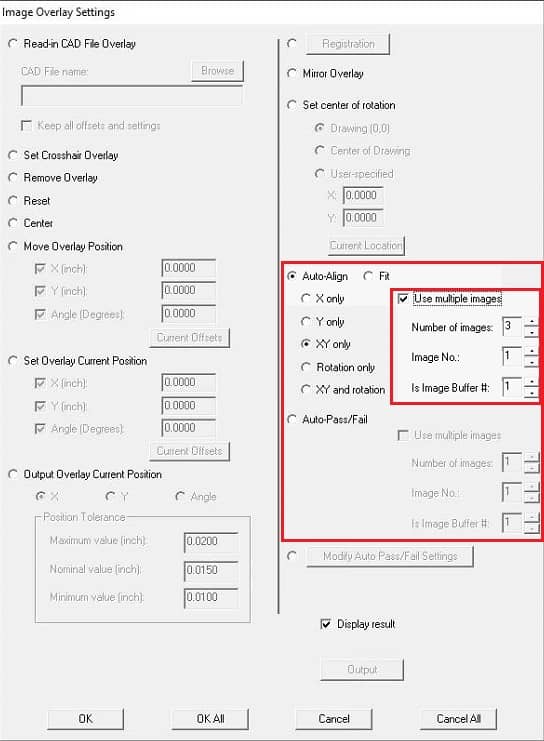
Our enhanced CAD Auto-Align™ capabilities across multiple fields-of-view and depth-of-field have been added to various places in the Program Toolbox. In the Auto Pass/Fail Control Sections Setup for a CAD file, a control section can now be associated with a particular image buffer. Image buffers are also setup in the Program Toolbox – Image Capture step to associate a location with an image buffer. The Program Toolbox – Image Overlay step “Auto-Align/Fit” and “Auto Pass/Fail” operations can now use the multiple image buffers that were previously setup to run these multi-FOV operations.
Read more about our enhanced CAD Auto-Align™ beyond the field-of-view.
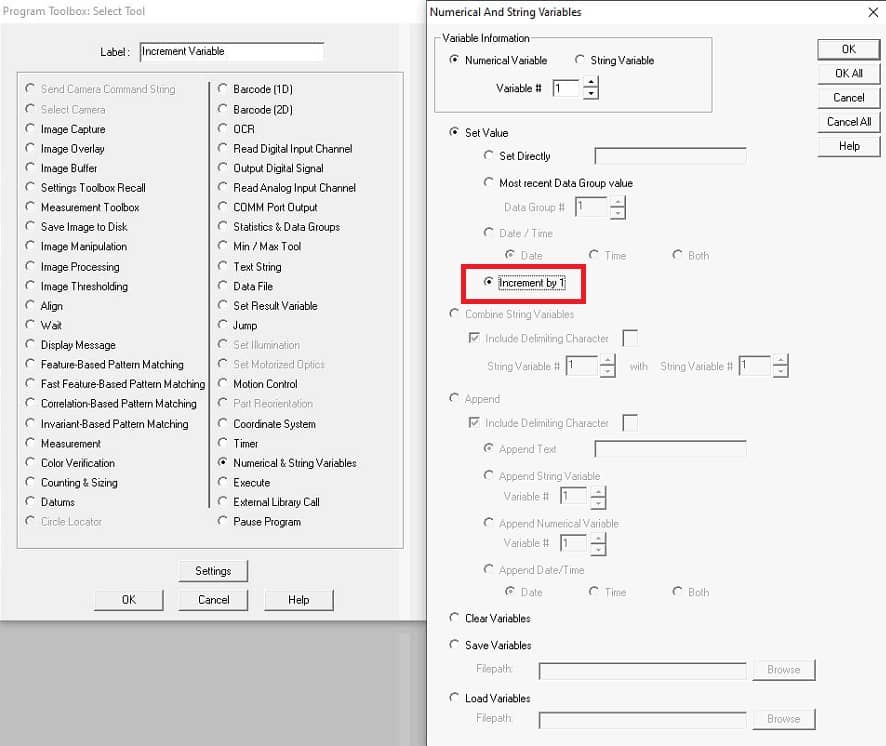
Program Toolbox “Numerical and String Variables” settings
We have added a new “Increment” sub-option for the “Set Value” operation in the Program Toolbox – Numerical and String Variables program step. This “Increment” option is only valid for Numerical Variables. When activated for a Numerical Variable, the selected Numerical Variable will have +1 added to its value. With this, the program can increment a numerical variable under various circumstances during the program flow, and the modified variable can be re-used as needed.
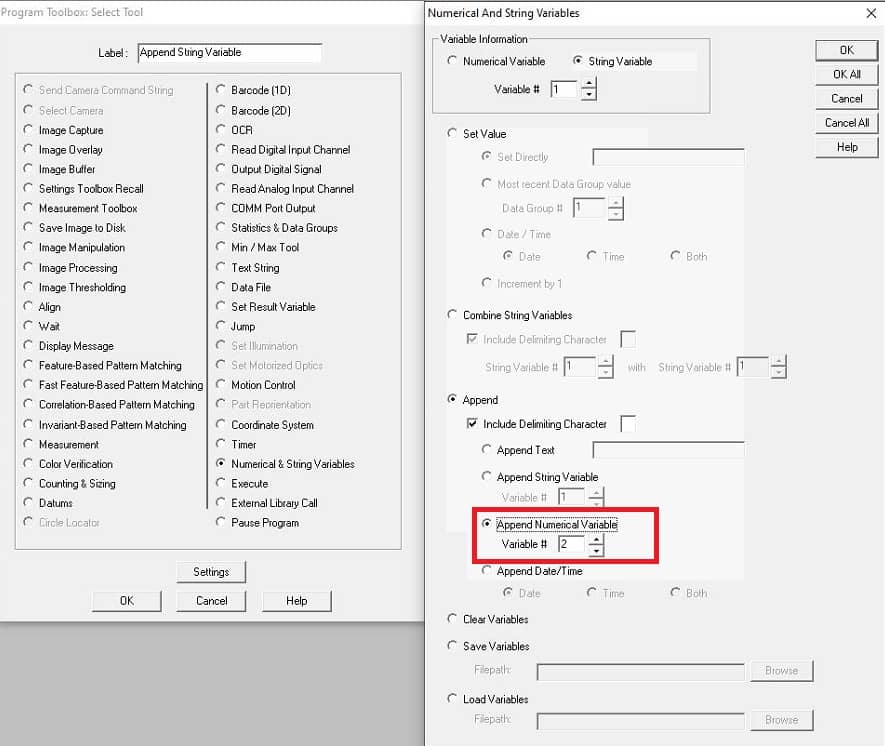
We have also added an option to append a Numerical Variable to an existing String Variable. This may be useful when building label strings for output or creating messages for operators.
Program Toolbox – “Pause” Settings
This update enhances the Program Toolbox “Pause” operation with new options.
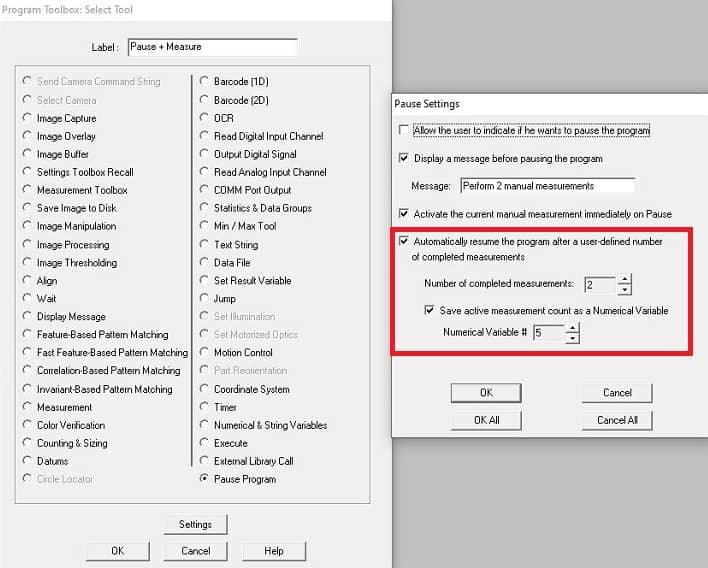
The option to “Activate the current measurement” will pause the program and immediately start the currently loaded Manual Measurement (as selected from a previous “Measurement Toolbox” program step in the program, for example). This will let an operator immediately start pre-loaded manual measurements, if required as part of an inspection process.
When the “Automatically resume program after a user-defined number of completed measurements” option is enabled, the paused program will resume operation after the user-indicated number of manual measurement/output operations have been completed. Actions that count as a completed measurements are 1) a standard manual measurement with normal termination, and 2) pressing the “Output” button in the “DXF Overlay Translation / Rotation” window if there is a successful output to the Data Group.
Additionally, the Pause Settings can save the number of the currently active measurements being counted as a Numerical Variable. This could be useful when building label strings for Data Group output.
These new Pause Settings options can help streamline any manual operator interactions that may need to occur during an automated program, depending on your application.
Program Toolbox – Image Overlay – Modify Auto-Pass/Fail Settings
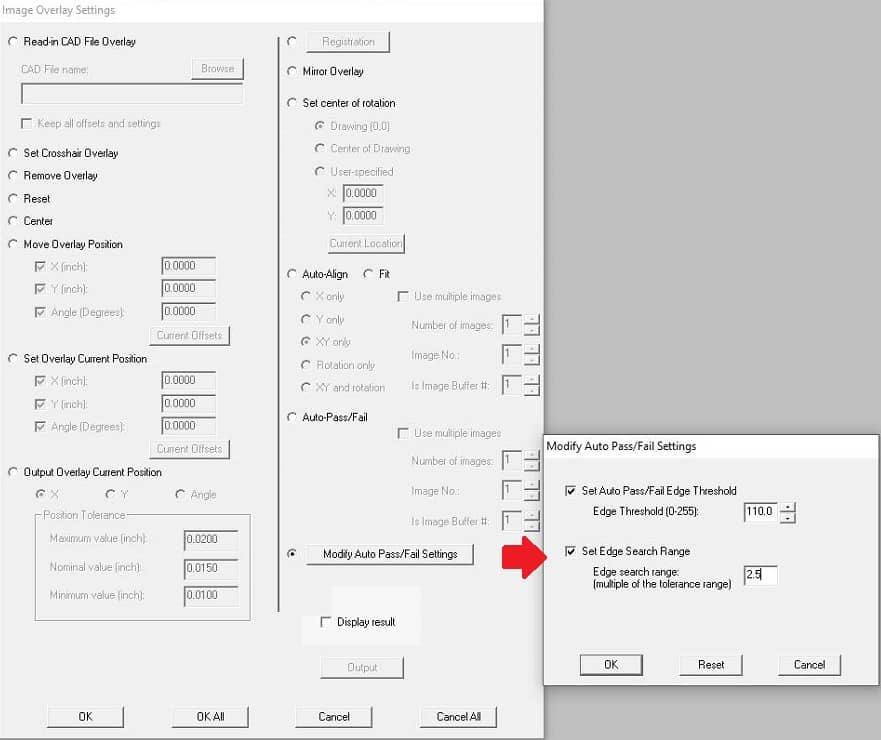
Support has been added to allow modifying additional Auto-Pass/Fail Settings during an automated program. These changes are found in the Program Toolbox – Image Overlay step.
Programs that already use the “Set Auto Pass/Fail Edge Threshold” operation will now find their existing settings included in the new “Modify Auto Pass/Fail Settings” operation button. The option to modify the “Edge Search Range” is also now included.
This new setting may be useful when a single inspection program requires changing the edge search range for different types of measurements or part requirements.
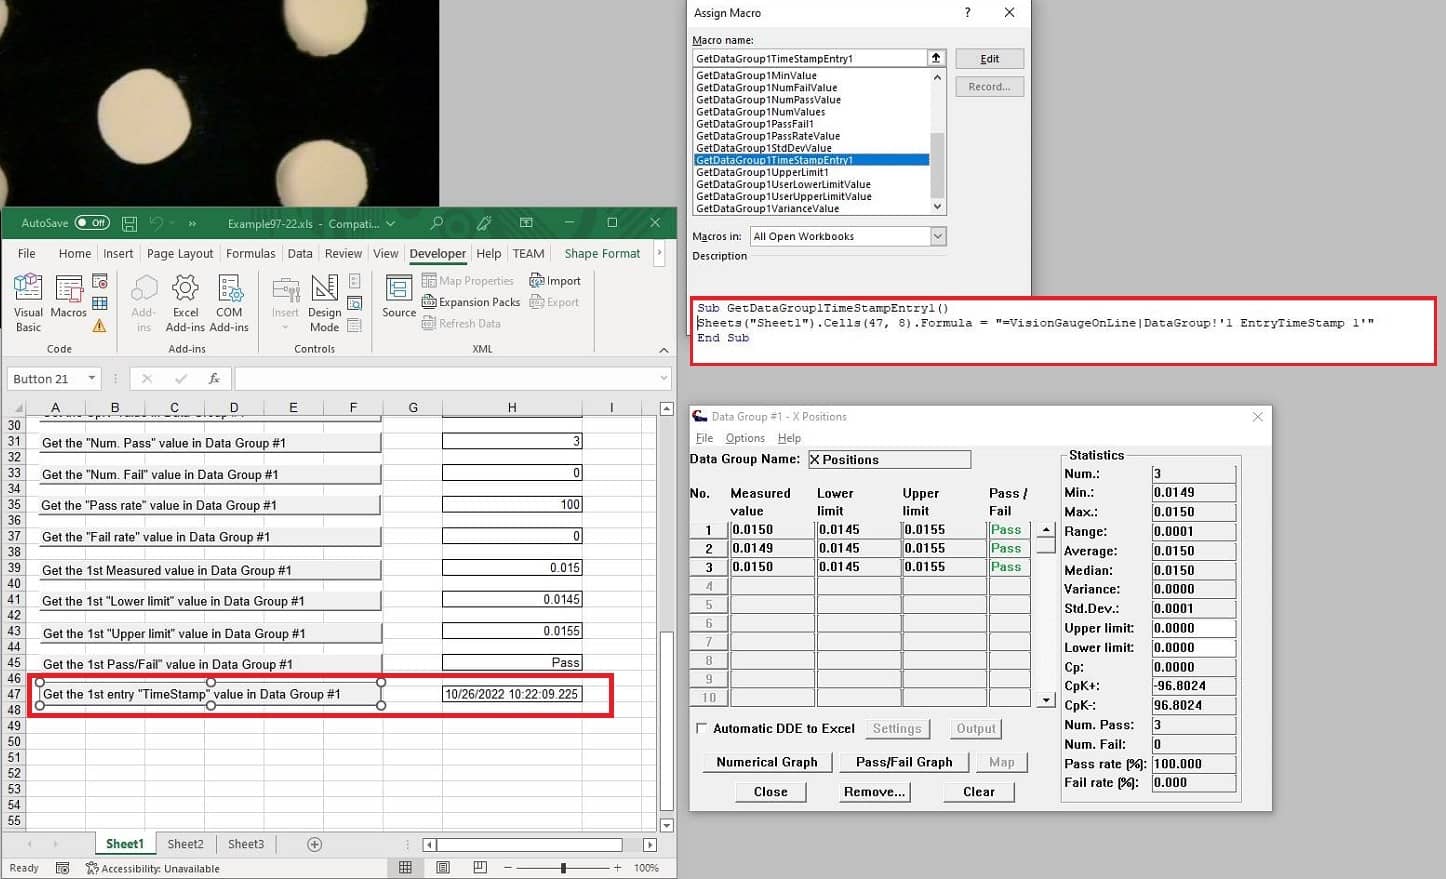
Data Group Entry Timestamps
A timestamp string has been included for each entry that is added into a Data Group. This timestamp string will be accessible for request from DDE commands with the “EntryTimeStamp” keyword and returns the timestamp in the format “Month/Day/Year Hour:Minute:Second.Millisecond”
An example of the formula is: “=VisionGaugeOnLine|DataGroup!’1 EntryTimeStamp 1′”
This command in the “DataGroup” topic requires 3 pieces of information to properly complete in the single quotes:
The number of the Data Group to target
EntryTimeStamp – to obtain the timestamp data for this entry
The entry number in the Data Group to return the timestamp.
The Excel Report example in the C:/vgOnLine/Reports/Excel_Examples/ directory has also been updated (and renamed) with an example of this command transferring the timestamp for the first value in Data Group #1 of VisionGauge OnLine, using the formula shown above.
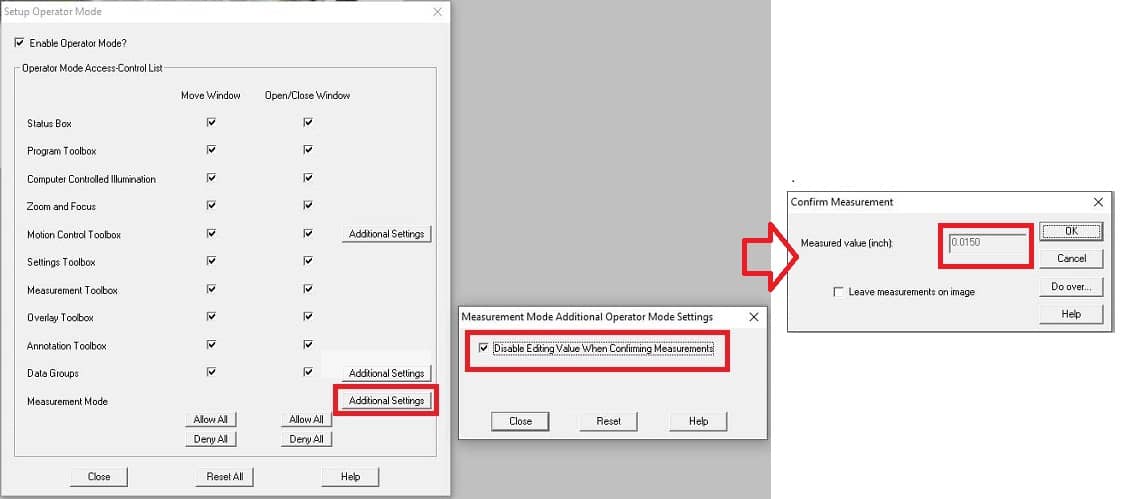
Operator Mode – Measurement Mode
This update adds a new option to the Operator Mode for the “Measurement Mode”. In this setting, an Administrator can select if the ‘edit box’ for manual measurements is disabled when the option to “Allow user to confirm measurements” is selected. If this option is disabled (as it is by default) the user can input any value into this text box and this is the result that would populate the Data Group. By disabling this edit box, the user is still allowed to ‘re-do’ the measurement if they choose, but they cannot manually edit what the measurement result is.
Note that this setting affects the measurement value that is inserted into the Data Group – the annotations created by the user are unaffected.
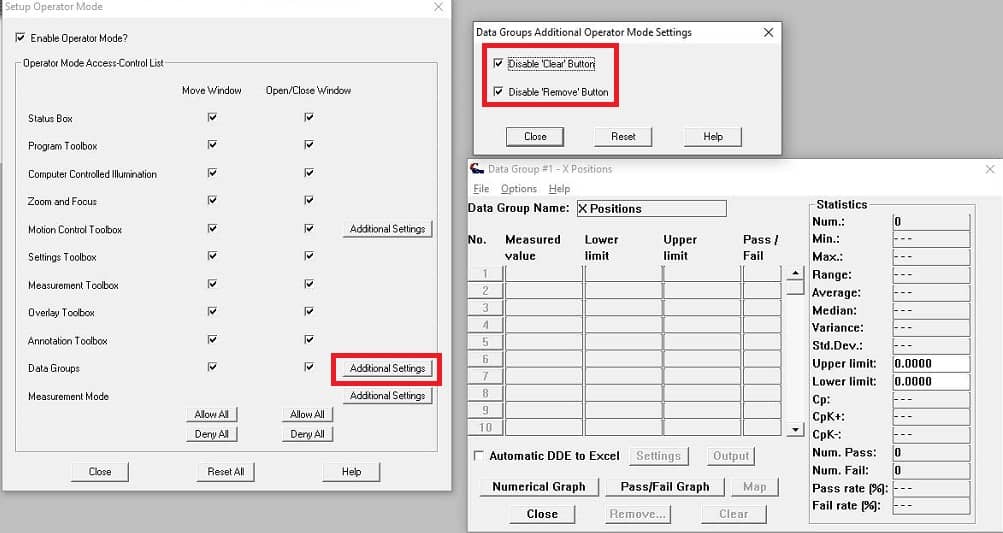
Operator Mode – Data Group Additional Settings
This update includes a new “Special Permissions” option for Data Groups in Operator Mode as “Additional Settings”. This option will allow an Administrator to allow/deny operator access to the “Clear” or “Remove” buttons across all Data Groups, as well as to disable editing the label in Data Groups, if present. As usual, Operator Mode must be turned on to be able to deny access.
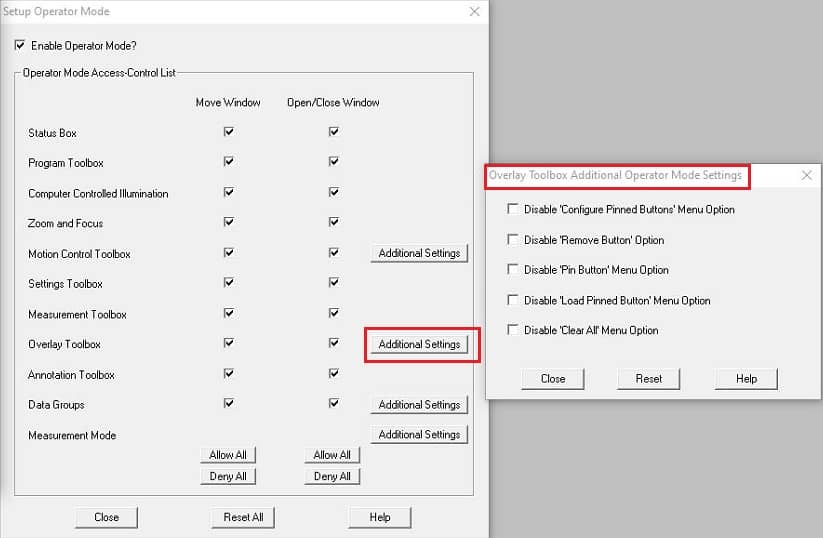
Operator Mode – Overlay Toolbox Additional Settings
We have also added new “Additional Settings” in the Operator Mode for various DXF Overlay Toolbox features, including the ability to enable/disable removing, loading, and pinning button contents.
DXF Correspondence File Updates for String/Numerical Variables
This update adds two new options at the end of each DXF Correspondence File entry to load String or Numerical Variables with data. These are 2 new comma-separated options allowing the user to choose the variable type (String/Numerical) and number (currently #1-20) to load, in addition to the data to store. Entire sets of String/Numerical Variables can also be loaded at once with pre-saved files. The loaded String/Numerical Variables are then available to the user during future software actions.
Version 1.3 of the DXF Correspondence File guide is available for download.
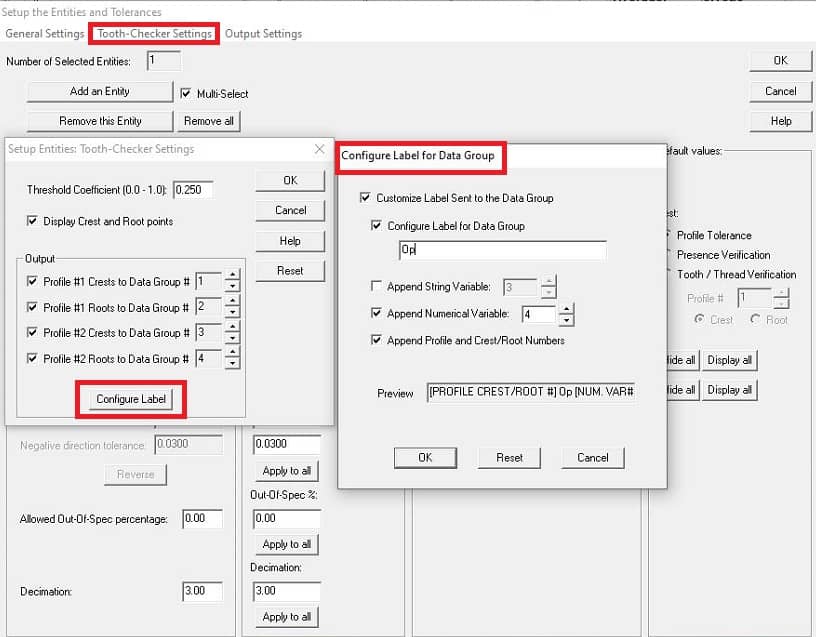
A “Configure Label” option has been added to the Tooth Checker entities setup dialog, allowing the output from this mode to override the default label sent to the Data Group. Options to build this configurable label are:
User-defined label string
String Variable
Numerical Variable
Current Profile # and Crest/Root #
The order in which these options are selected is also recorded, and the Preview edit box displays the current setup during configuration.
Area and Pathline Measurements
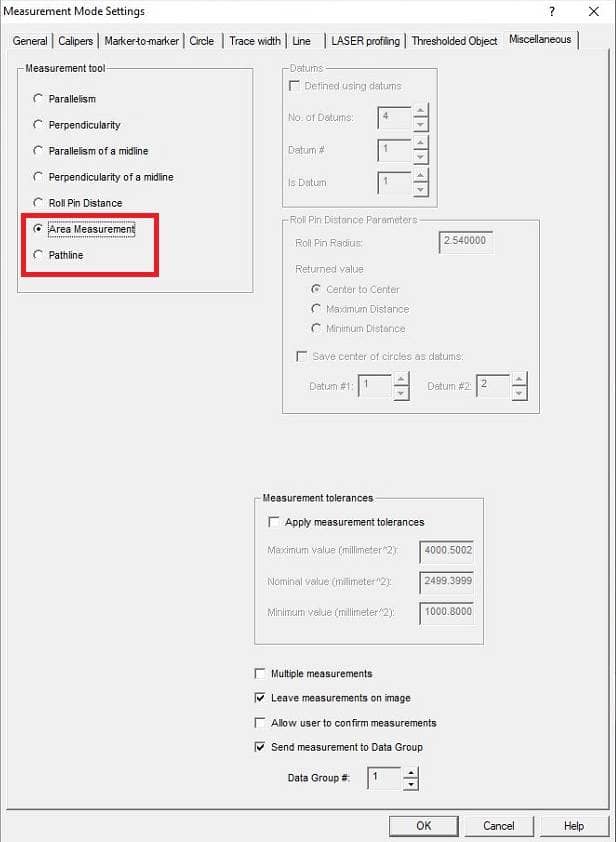
We have added support for Area and Pathline manual measurements in VisionGauge® OnLine. These measurements may be found in Settings – Measurement Mode (or the “Mode” button of the Measurement Toolbox) in the “Miscellaneous” tab.
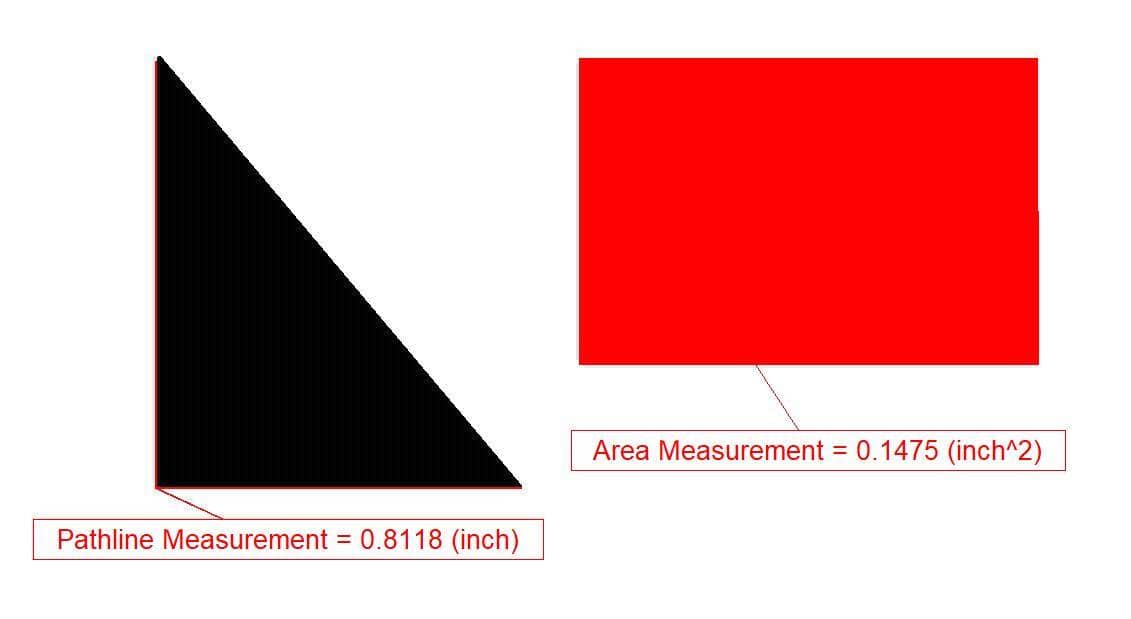
Pathline measurements allow the user to start ‘free-hand’ drawing a path with the cursor, when activated. Click once to start, then move the mouse to trace the path, and click the mouse again to finish. When the measurement is stopped, the total distance traveled along the drawn path is calculated in the current measurement units.
The Area measurement allows the user to outline a closed region on the image and select the region (inside or outside a closed region) for which they want to obtain an area measurement of all pixels included in that region.
Straight-Line and Free-Hand drawing methods are available and can be interchanged during a drawing mode in the dialog box that opens when starting the measurement. After the user has drawn a region, they must select the “Close Area” button which draws a final straight line between the last point selected and the first point. The user must confirm that they accept this closed region before continuing.
After the region is closed, the user must then use the cursor to select the region for which they want to obtain the area measurement: This can be inside or outside the drawn region. The final value returned is the area in the current measurement units of all pixels included in the selected region.
Intersection of a Circle and a Line & Orthogonal to a Tangent Line to a Circle Manual Measurements
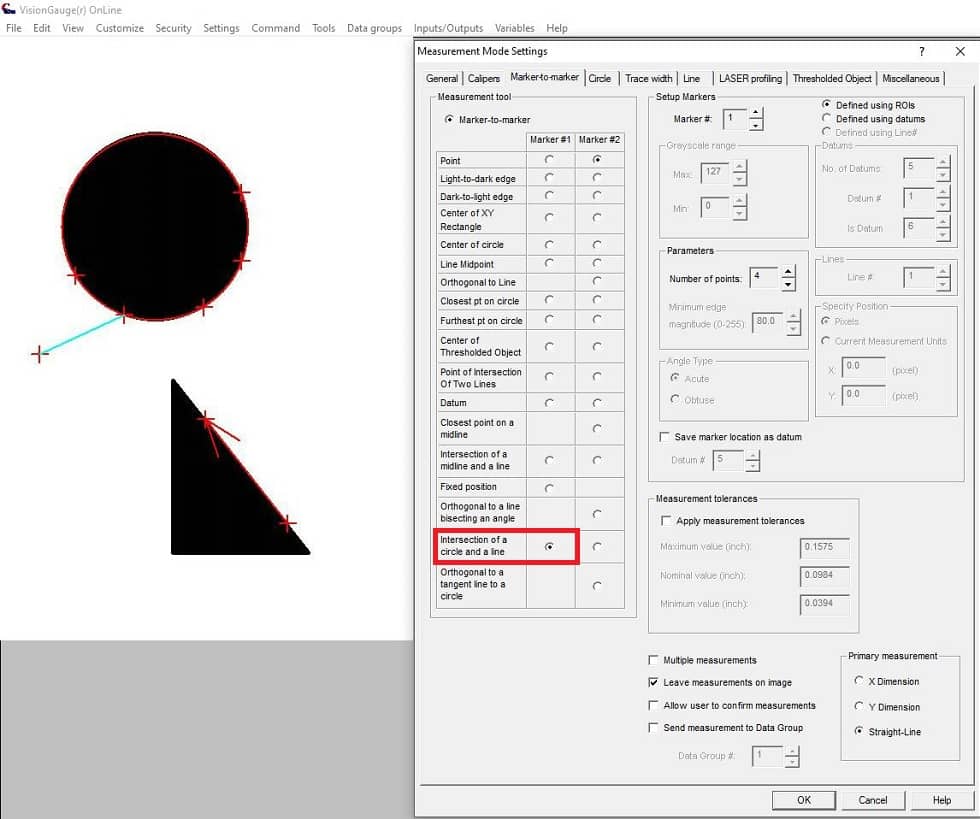
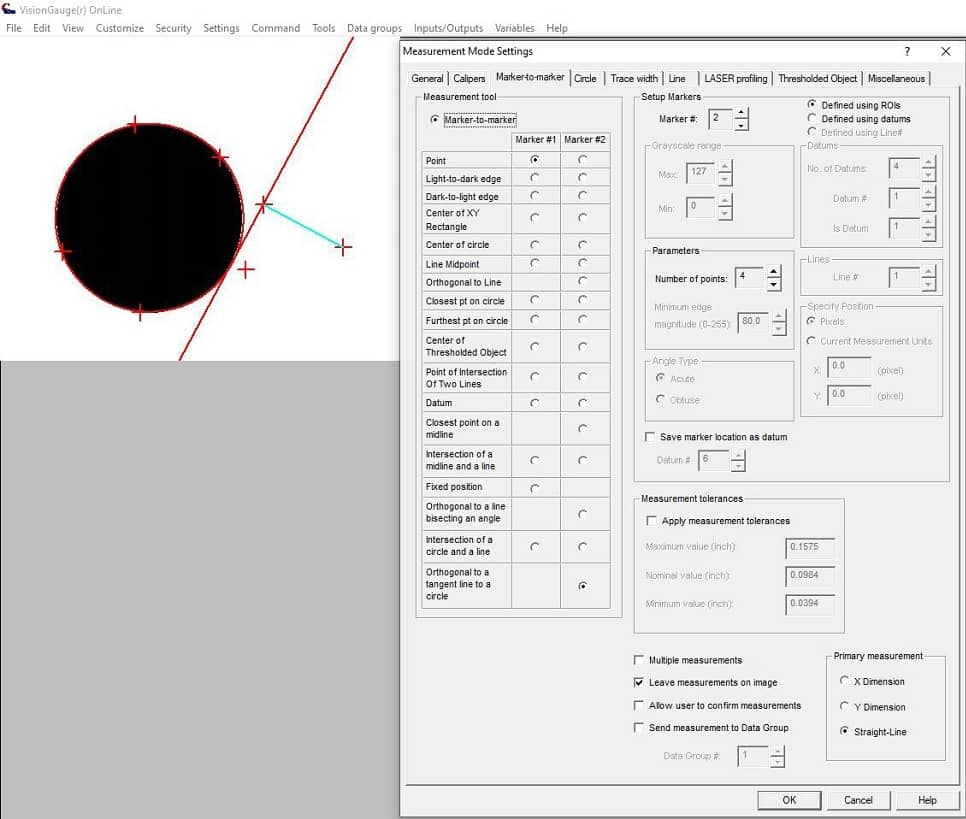
This update adds two new manual measurement tools to the Marker-to-Marker tab Measurement Mode: Intersection of a Circle and a Line Projection & Orthogonal to a Tangent Line to a Circle
Intersection of a Circle and a Line Projection:
This Marker-to-Marker measurement tool can be defined as both Marker 1 and Marker 2. It requires defining first a circle followed by 2 points to define a line. You can also define this tool with datums. If defining the marker with datums, the minimum number of datums is 5 (3 points minimum to define the circle and 2 points to define the line). When selecting a larger number of datums, the number of points to define the circle must always be the number of datums defined – 2.
If you define the measurement with ROI (default), choose the number of points to define the circle as usual. You will then select that number of measurement points + 2 for the line.
The following rules apply when selecting the intersection point, considering the line selected both as a segment and as a projection:
The measurement will fail if the projection of the line does not intersect with the circle at all, in the direction the line is defined.
If the line projection intersects with the circle at a tangent point, that point will be the marker.
If the line segment intersects with/crosses the edge of the circle at one point, that point will be defined as the marker.
If the line segment intersects with the edge of the circle at two points, the point closest to the 2nd line definition point will be selected as the marker.
Finally, if the line segment does not cross the circle, but the line projection in the direction the line is defined does cross the circle, the first point on the edge of the circle along the line projection will be the marker.
In the following example, the measurement is defined with ROIs and 4 points are being used to define the circle. 2 more points define the line in the direction towards the circle. The line segment defined on the 2 lines points does not cross the circle, but the projection of the line does intersect with the circle, so the first intersection point of the line projection on the circle is returned as the marker.
Orthogonal to a Tangent Line to a Circle
This Marker-to-Marker tool can only be defined as Marker 2. It requires defining first a circle followed by a single point which draws a tangent line at the closest point to the circle. You can also define this tool with datums. If defining the marker with datums, the minimum number of datums is 4 (3 minimum points to define the circle and 1 point to define the tangent line). When selecting a larger number of datums, the number of points to define the circle must always be the number of datums defined – 1.
If you define the measurement with ROIs (default), choose the number of points to define the circle as usual. You will then select that number of measurement points + 1 for the tangent line.
In the following example, 4 points are used to define the circle, and a tangent line on the circle is defined with the last point using the closest point on the circle. The resulting measurement is the closest point on the tangent line to marker 1.
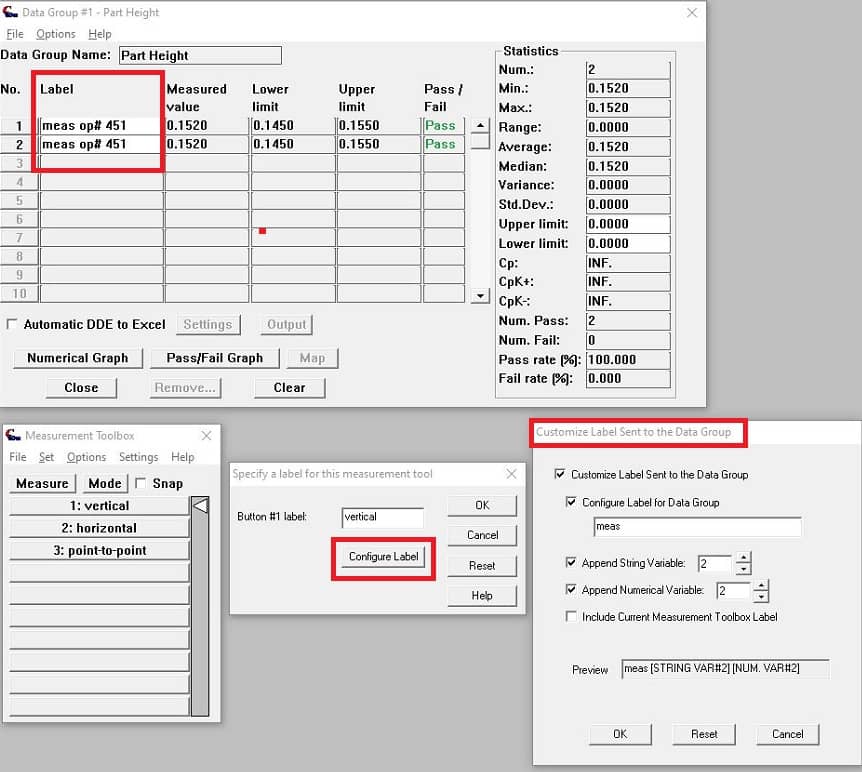
“Configure Label” option for Measurement Toolbox buttons
This update adds a new option allowing the user to customize the label that will be output to a Data Group when performing a manual measurement stored in the Measurement Toolbox. Previously, only the Measurement Toolbox label for the activated button would be sent to the Data Group. The new customized label may be sent to the “Label” entry of the targeted Data Group at the same time as the measurement.
This label customization option is available in the “Set” option when specifying the content to save into a Measurement Toolbox button. Users can build a customized label string with the following options:
User-defined label string
String Variable
Numerical Variable
Current Measurement Toolbox label string
The order in which these options are selected is also recorded, and the Preview edit box displays the current setup during configuration.
Restoring Measurement Toolbox Snap Radius and Snap Mode
This update also allows the current snap radius and snap mode to be saved with the Measurement Toolbox. This may be useful for applications that require loading multiple Measurement Toolboxes with different snap criteria.
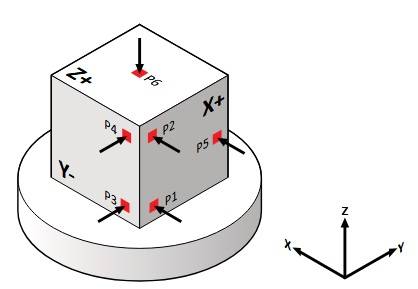
We’ve carried out very significant enhancements to VisionGauge® 6-Point Nest / Reorient Tool, to make it even more widely applicable. Detailed external documentation had been created for this
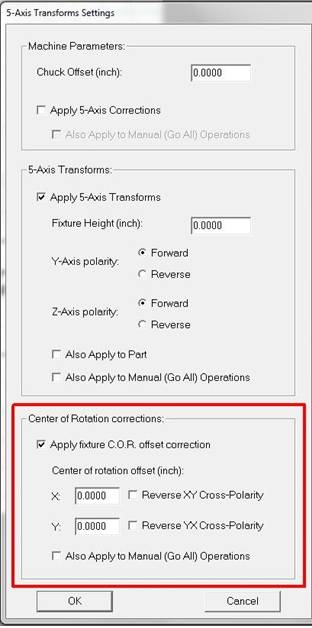
We’ve added cross-polarity corrections for our center-of-rotation corrections
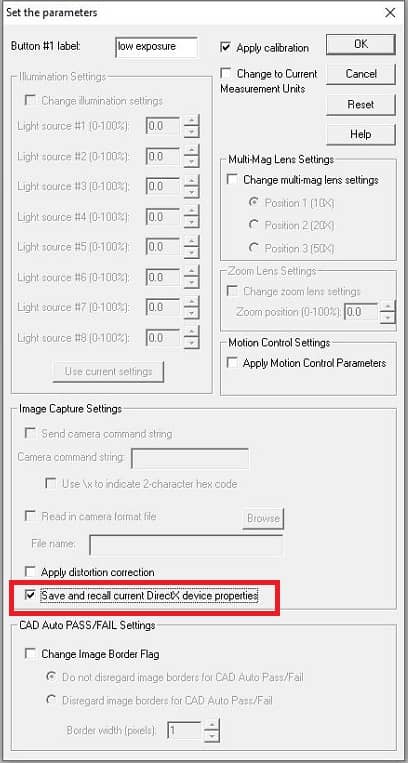
For systems using DirectX-compliant video capture devices, we have added the ability to save and recall DirectX camera properties when shutting down and restarting the software. Examples of these standard properties are exposure, gain, brightness, white balance, etc…
We’ve also added support to allow users to save the currently loaded properties to the Settings Toolbox (for DirectX-supported devices). This is useful to quickly recall device properties without having to manually change these settings.
“Distortion Correction” has been added to the list of Factory Locked-out Session items. This is primarily useful for technicians in the field required to carry out distortion correction as part of maintenance.
- We’ve carried out some enhancements to our “Feature Based Pattern Matching” tool, to enhance its speed & robustness.
- This update contains a number of enhancements (including significant speedups, etc…) mostly having to do with the software’s ability to read-in tolerances directly from CAD files.
- We’ve carried out very significant performance enhancements to speedup live video image refresh when working with very (!) large DXF files, especially at high magnification. These new enhancements provide a tremendous speedup in the case of very large files, a medium speedup in the case of medium-size files and very little speedup (if any at all) in the case of very small files (i.e. drawings that fit completely in the field-of-view).
The following fixes have also been made:
- We have corrected an issue in the Program Toolbox – Wait program step, when the “Wait for User Input” option may save the input result as a String Variable, even if the option to save the result is unchecked.
- In the Program Toolbox – Image Overlay step, the “Auto-Align” operation would apply corrections at the end of the step as if an Auto-Align mode with rotation had been selected. This could cause the overlay to move to unintended locations if XY, X-, or Y- only Auto-Align modes were selected, if a default Auto-Align mode had not been previously selected.
- If a program running in the Program Toolbox was paused, the software could crash when attempting to resume the program if live video was displaying.
- An issue has been resolved where Auto-Focus may not work in an automated program following a “Pause” step.
- In the Program Toolbox, the “Run To” program mode will now properly activate a “Pause” operation in the program.
- We’ve fixed a bug related to carrying over sub-directories from session-to-session.