
VisionGauge® is a powerful tool for non-contact visual measurements. It uses advanced edge-detection technology that produces sub-pixel accuracy, increases measurement repeatability and virtually eliminates operator dependent measurement error.
VisionGauge® is very simple to use and supports a wide range of measurement tools: from simple point-to-point measurements, diameters, radii, angles, and XY calipers to skew-corrected parallel hashlines and powerful and flexible marker-to-marker measurements, as well as fully-automated measurement software tools (e.g. line width, area calculation, and more).
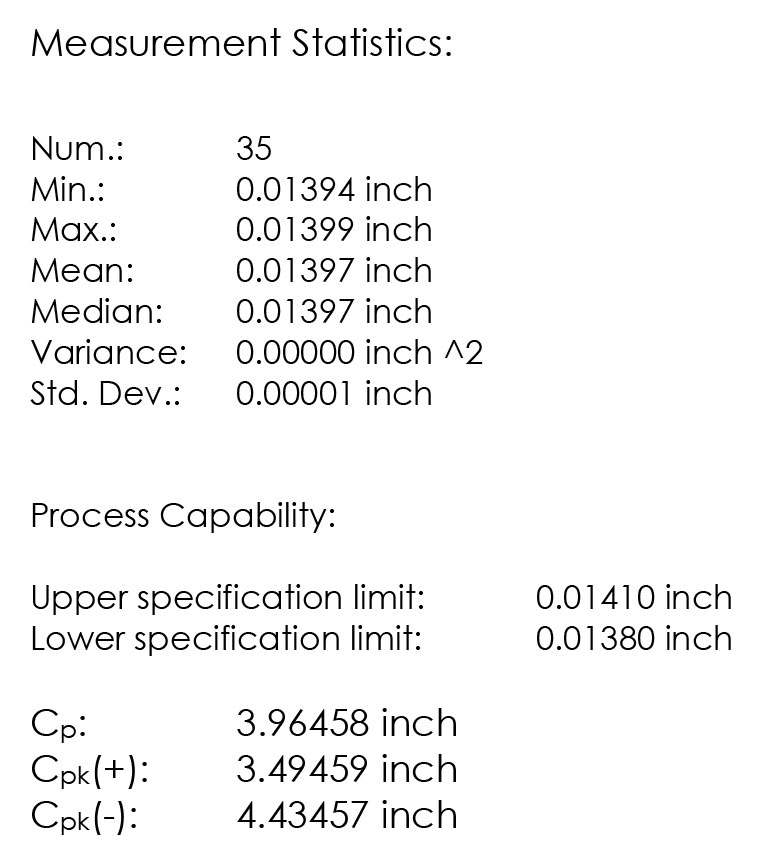
You can use VisionGauge® to compute measurement statistics, including sample mean, median, minimum and maximum, variance and standard deviation, as well as process capability statistics (i.e. Cp and Cpk). With VisionGauge®, it is easy to manage all of your data (i.e. images, measurements and statistics):
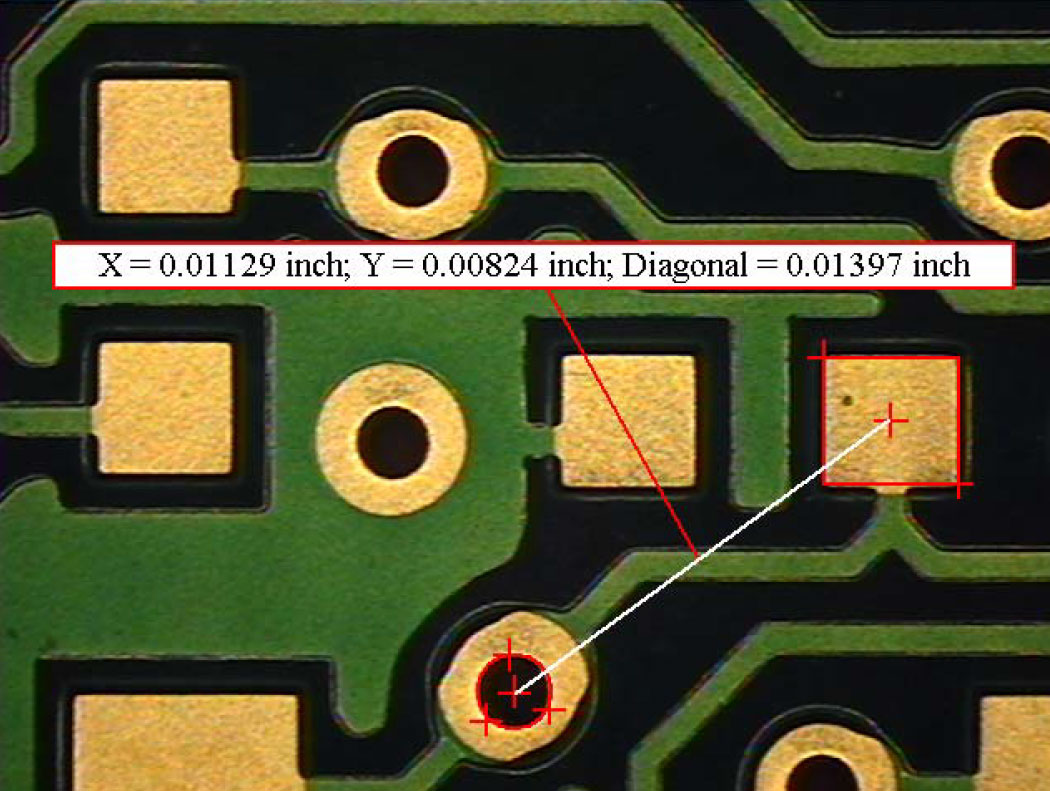
Here is an example of a simple marker-to-marker measurement. In this case, we are measuring from the center of the hole to the center of the pad. X, Y and “straight line” distances are shown:
Download a pdf with information about VisionGauge®’s Measurement Tools and Statistics Toolbox.
VisionGauge® allows users to create customized measurement reports, storing an image, measurements, and text descriptions for each report. Reports can be used as templates for operators to fill in or standalone inspection reports for each part saved to the VisionGauge®’s integrated database.
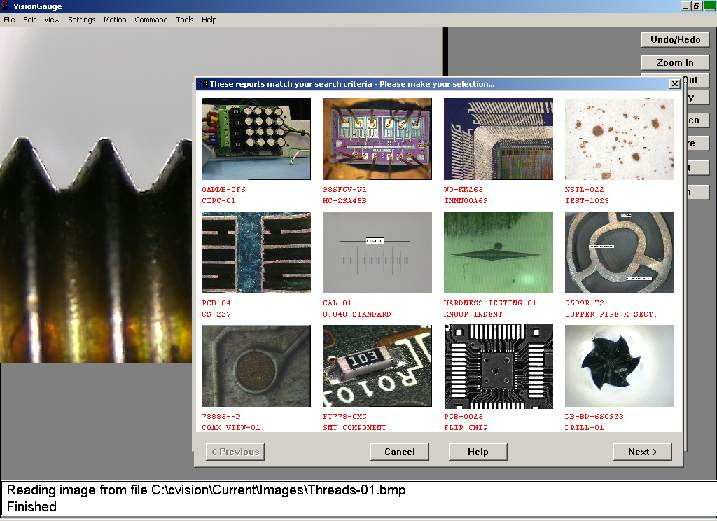
You can use VisionGauge®’s enhanced “Database Search” tools to call up all of the reports in VisionGauge®’s report database that contain a specific search string (for example: a date, an evocative keyword, a specialized term, etc…). These enhanced “Database Search” tools work seamlessly with VisionGauge®’s integrated Report Generator and Database.
To carry out a search, simply type-in a search string and VisionGauge® shows you all of the reports in which it can be found, sixteen at a time. For each matching report, VisionGauge®’s “Database Search” tools display a thumbnail preview image, along with two “key field” strings. Then, when you click on the image of the report that you’re looking for, VisionGauge® retrieves it from the database and loads it into the Report generator.
Download a pdf with information about VisionGauge®’s Database Tools with “Thumbnail” Preview Image Gallery.

Are you interested in streamlining your inspection process with VisionGauge® Digital Optical Comparators and optical measuring systems? As your vision inspection system manufacturer, we’re available to provide support at any time, so browse our selection of products or contact us online today.
Learn More